
Design and Data Visualization
In researching complicated and nuanced topics, we aim to produce work that communicates clearly. Parsing what can frequently be a dense tangle of architectural data, visualizations can serve to explore new concepts, clarify ideas, and ultimately, make informed design decisions.

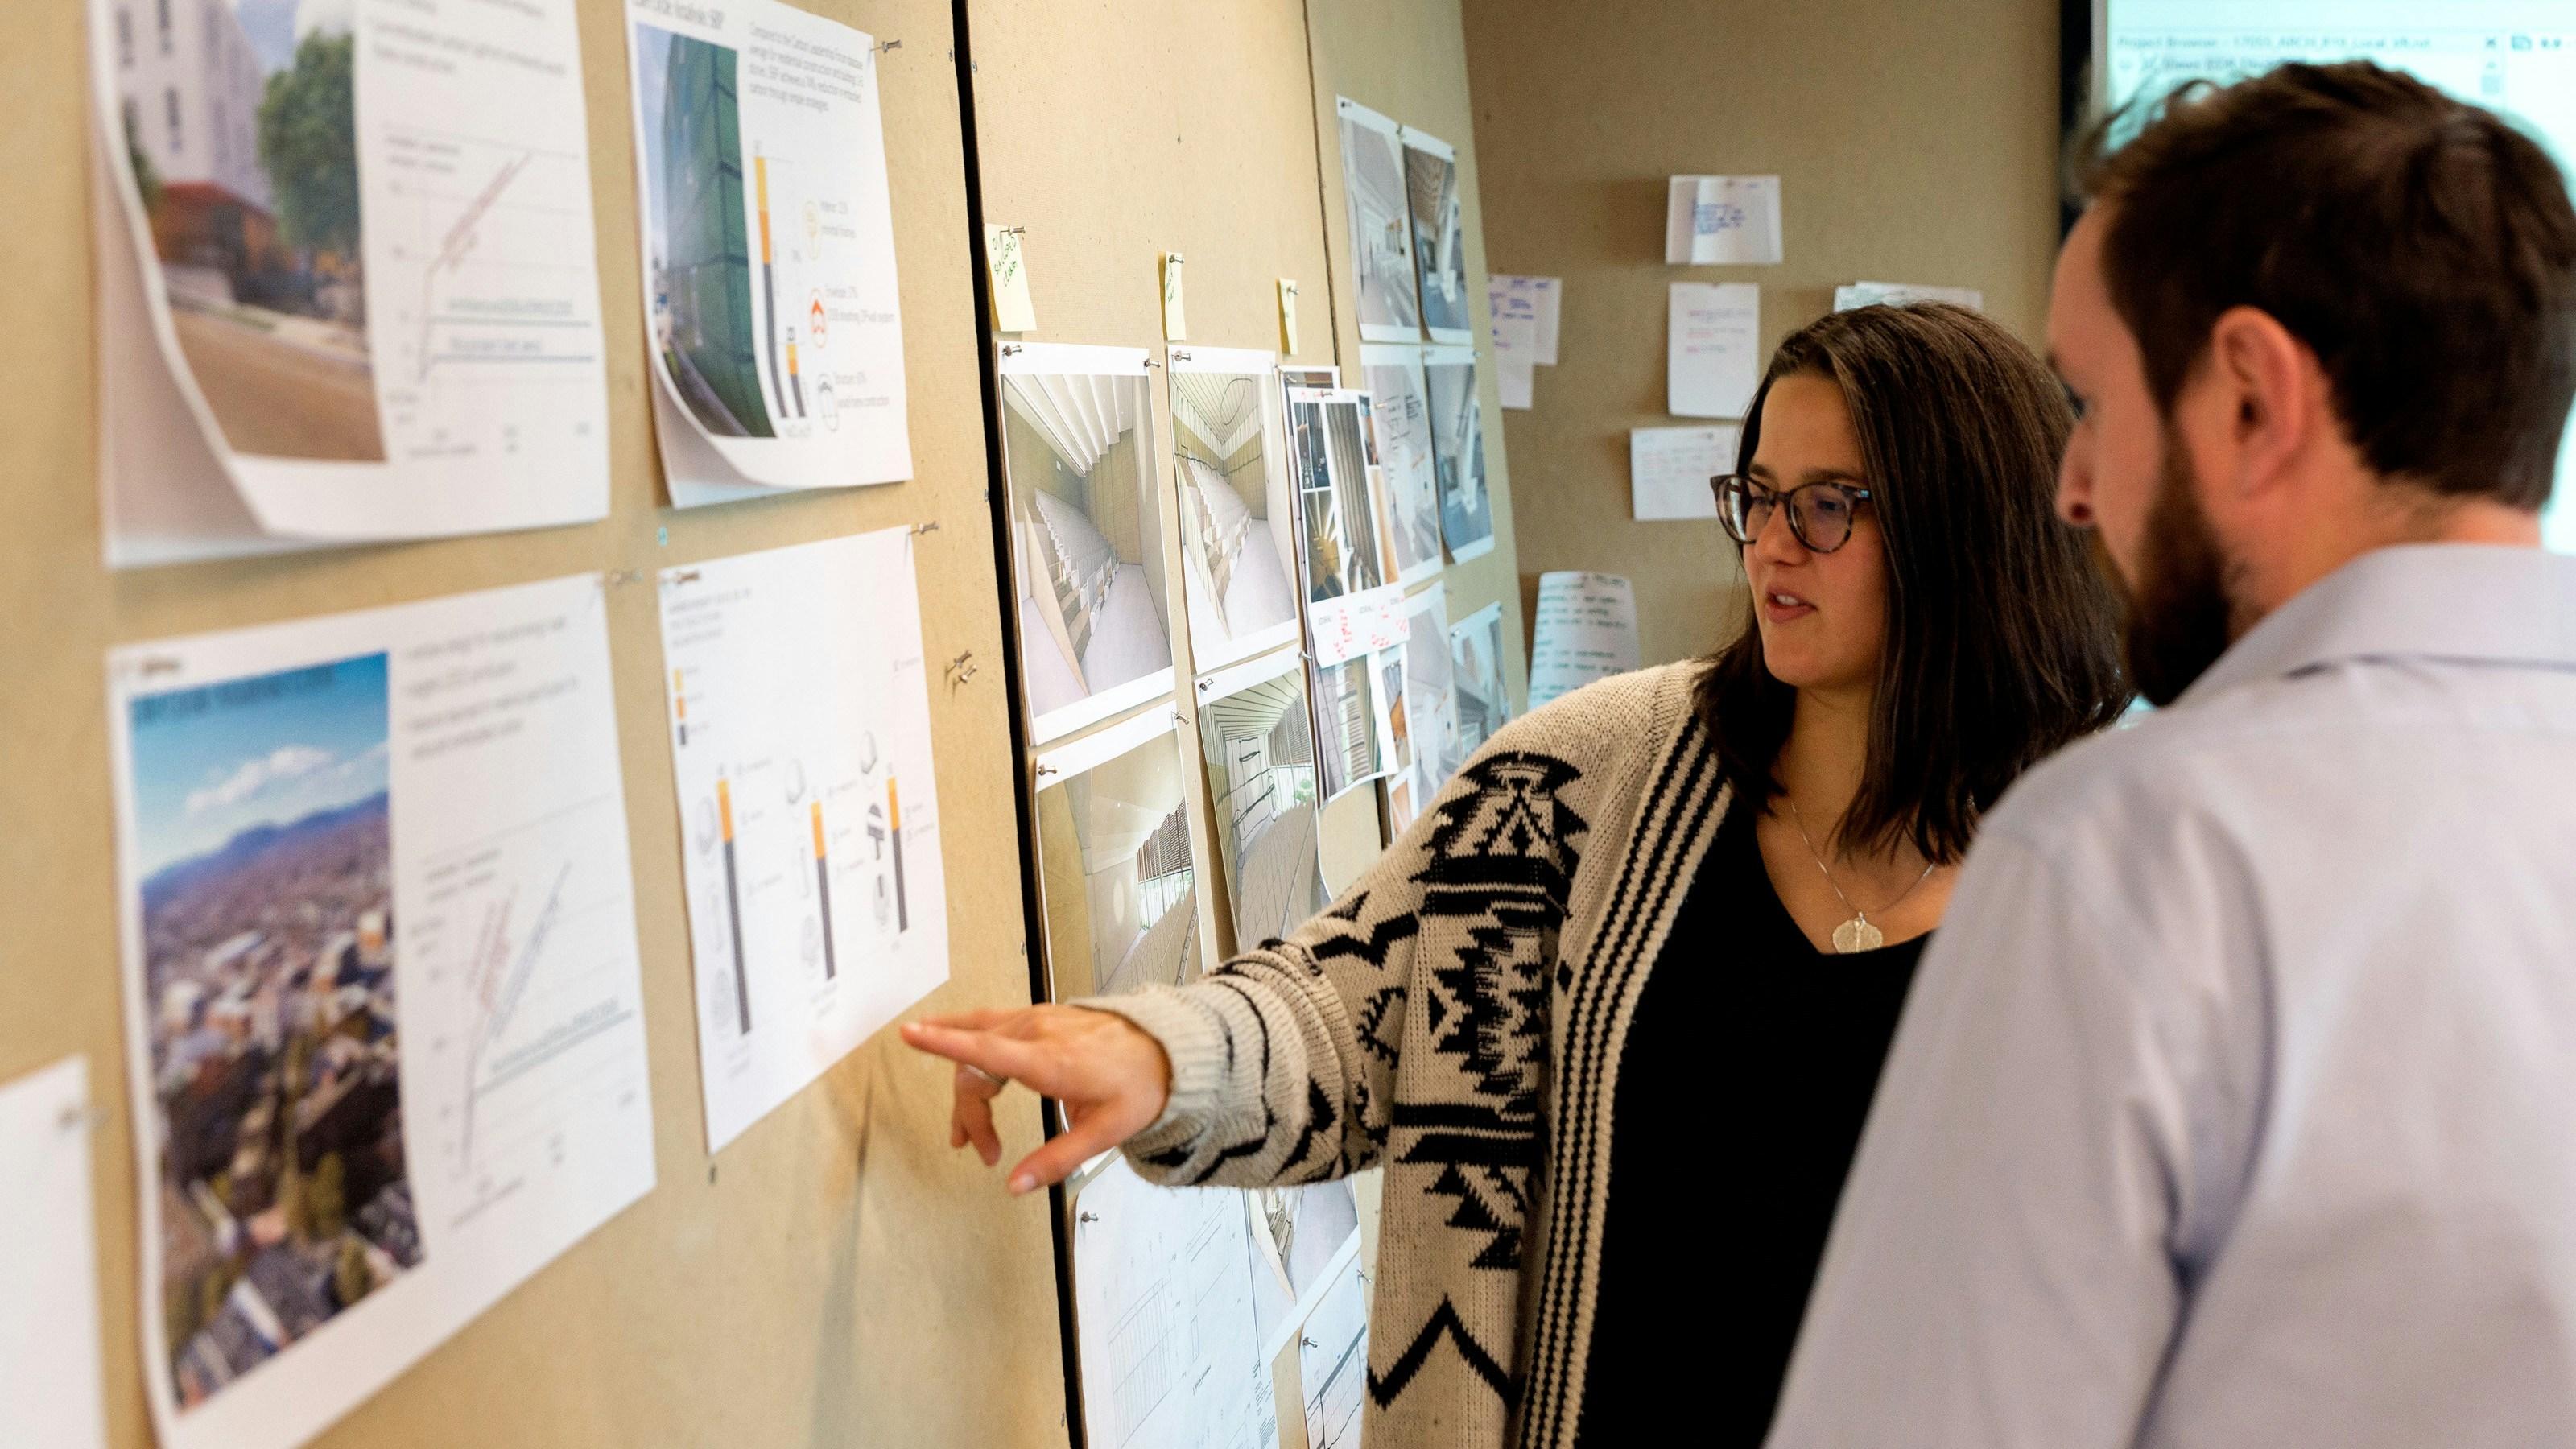
Research Fellow Kelsey Wotila and Architect Mike Johnson discuss a visualization exploring structural systems for the Center of Developing Entrepreneurs in Charlottesville, VA
The concept of using pictures to understand data has been around for centuries. In a profession where drawings are the primary language by which we communicate, the historical need to visually convey complex concepts is well established. With new technology, this need becomes all the more relevant. Modern architectural tools have introduced a treasure trove of data from which we can learn and communicate the world of design. This treasure trove of data, for the untrained eye, can prove increasingly complex to grasp. Visualizations are the great equalizer. In communicating a dense amount of data, visualizations can serve as a meaningful resource throughout the duration of a project, one we’re able to manipulate as variables change.
Recently our studio, with the aid of 2020 Research Fellows Kelsey Wotila and Kevin He, has focused this exploration on one of the 21st century’s most pressing challenges: embodied carbon.

Comparison throughout building life of different louvre types at varied window wall ratios charted in cost and total lifetime carbon per square foot.
Embodied carbon is a critical topic in the design realm. The construction industry makes up 40% of carbon emissions globally, with 11% being materials-based, and design decisions made early in the project lifecycle hold tremendous power over this output. While we have learned how to reduce operational emissions over the building’s lifespan, the question remains - are the strategies we consider and implement worth their carbon savings? We set out to explore various early design decisions and their impact on embodied carbon in final construction. As an example, what is the impact of window-wall ratio and louvre material on both total lifetime carbon costs and construction costs for curtain wall systems?
Visualization of various louvre materials, window wall ratios, louvre sizing and placement in terms of their performance and cost is stronger and more easily absorbed than a table with the numbers alone.
The below graph charts 4 different variables: total lifetime carbon cost per square foot of the facade assembly (carbon intensity), construction cost per square foot of the facade assembly (cost efficiency), louvre types, and Window-Wall Ratios.
Primary inputs are manipulated in the shoebox model: Window-Wall Ratio, Louvre Material (glass, aluminum, and wood), Louvre Size, spacing, and profile, Orientation of facade (NSEW), Horizontal or Vertical Louvres, and Location.
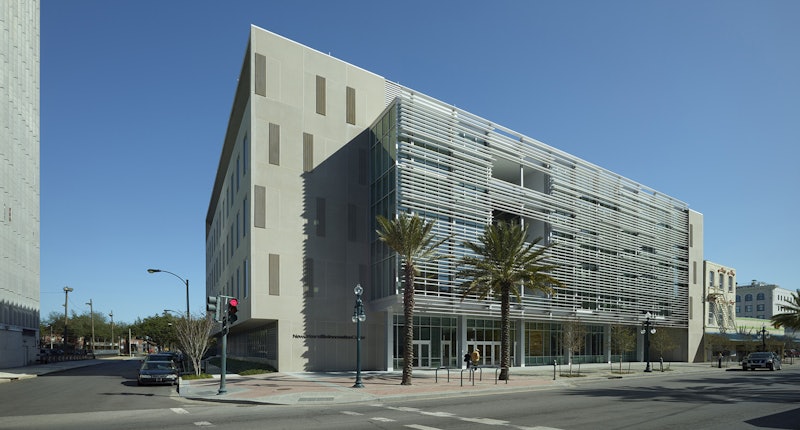
The New Orleans Bioinnovation Center, showcasing an elegant implementation of louvers. The 60% glazed facade functions as if it were 18% glazed.
For a generalized exploration, a shoebox model is an effective means of study. Evaluating louvres, our shoebox model was paired with shade analysis which generated the solar heat gain values that were then transferred to an excel sheet with all inputs and constants. Some constants are secondary inputs that contribute to carbon intensity of assumed cooling necessary to offset conductance and solar heat gain in scenarios with and without louvres. (Assumed cooling is calculated based on location and respective electric grid, and translated from kWh to lbsCO2eq. For New Orleans, we can assume that rate to be 1.13lbsCO2eq. per kWh.)
Lifetime carbon is calculated as the embodied carbon in the louvre along with its operational offset, or the solar heat gain saved by the shade provided by the louvre. The final image resulting from data analysis becomes a decision tree for a designer selecting a window wall ratio and louvre type to reach carbon and cost benchmarks. By displaying results through two quantitative axes, the graphic allows for decision-making simultaneously regarding both carbon and cost efficiency.

A comparative decision tree evaluating various louvre types over time. Cost and Embodied Carbon are displayed simultaneously with efficacy of the system after considering assumed cooling.
Another frequent exploration in the early outset of our projects involves the carbon emission intensity of various structural assemblies. Illustrating structure as a “kit-of-parts” (load-bearing walls, columns and beams, floor decks, and roof), the below graphic visualizes how these pieces effect the overall embodied carbon when combined.
Each of these pieces have varied materiality, from light gauge steel to CLT panels. Each material is associated with structural and weight implications as well as their own embodied carbon intensities.
Users can quickly see the graphic weight or heaviness of an assembly in terms of its embodied or upfront carbon emissions. The axonometric representation of the different materials and assembly types aid the viewer in making comparisons quickly and realizing a low-carbon decision in structural systems. While this data does not include figures for the foundation of each assembly, graphically the scale of foundation size and therefore carbon emissions is communicated, so a designer can infer either a savings or cost associated with structural system choice.

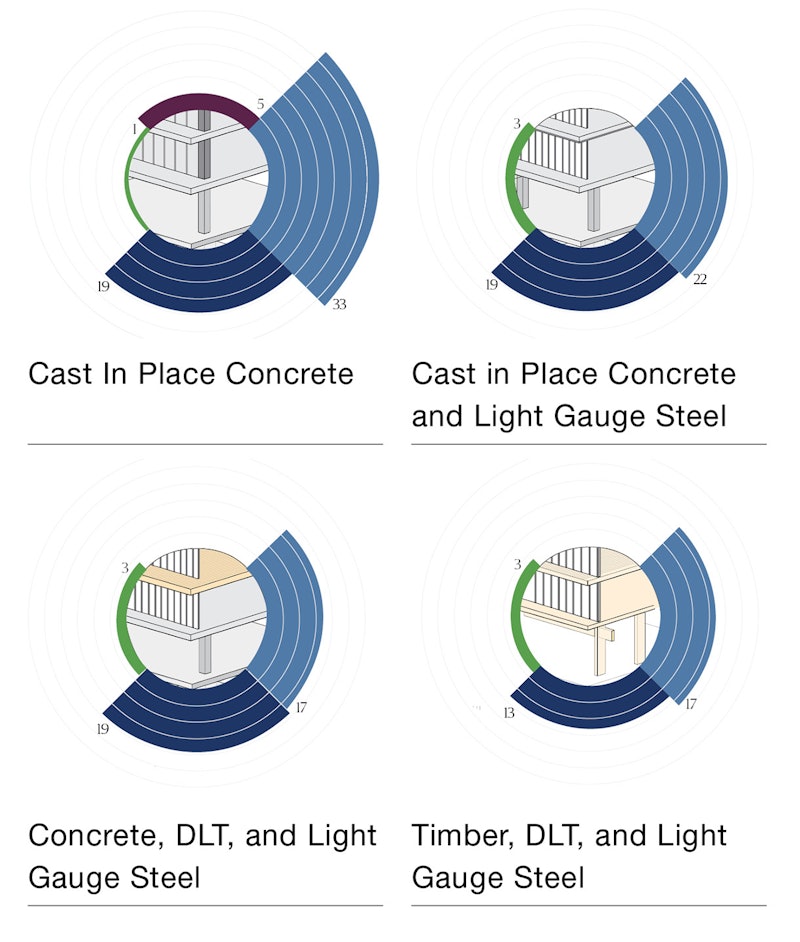
Research often aids our project teams in pursuing better design. In some definitions, better means designing in line with Architecture 2030 goals for embodied and operational carbon. In comparison to a benchmark building, Architecture 2030 seeks to reduce embodied carbon by a minimum of 40%, with that number growing from now til the year 2030. Structure is a high impact item due to material quantity through which we have design power to optimize quality and reduce impact. The first step in implementing these decisions is awareness. Establishing a simple reference guide for anyone on the project team to understand allows us to interpret and influence design decisions. Common structural assemblies are evaluated across the board, with the best option for low carbon displayed above: Timber Podium with CLT decks.

An early rendering for the Dalney Building at Georgia Tech, for which the team analyzed the impact of various structural systems on life-cycle costs
While generalized studies can help our project teams make universal decisions quickly and across project types, case-specific studies provide more detailed data and analysis, which can help us describe to a client their various options and assist them in making the best choice for cost, efficiency, and sustainability. A study of the Dalney Building at Georgia Tech set out to answer what the impact of structural system choice on life-cycle assessment of a building when considering remodel and change of occupancy/program. For more on this study, visit our blog post here.

An integrated dashboard and visualization tool created by a tandem of Power BI and Revit BIM to coordinate various door types and proper installation for a contractor on site.
Dedicated to evidence-based design, the above studies illustrate a sample of the ways we invest in research and study to influence our projects. In doing so, we raise awareness of and overall competence in best practice strategies across our firm. Turning research into graphic communication devices, project teams can quickly identify high impact opportunities that lie within our scope, with fundamental understanding ultimately contributing to the feedback loop of knowledge and innovation in architecture.